The roar of high-performance engines echoed through the arena as race teams fine-tuned their machines before the event. They relied on specialty equipment called dynamometers – “dynos” for short – to extract maximum power from each motor. By securing vehicles to spin heavy rollers, dynos provide precise power and torque measurements that optimize tuning. More than just gauging capabilities, dynamometers play an integral role in developing and testing all powertrains. Their ability to apply variable loads while tracking output through specialized sensors enables the recreation of diverse operating conditions, from daily commutes to all-out sprints. Understanding how dynamometers functionally overpower engines on demand can provide valuable insights into maximizing vehicle performance, a crucial aspect that the audience, as automotive enthusiasts and professionals, can deeply appreciate. This article will look inside the underlying principles governing dynamometer operation and measurement. We’ll examine how precision load application and sensing elements simulate strains powertrains face across numerous real-world scenarios right in the lab.
How Do Dynamometers Work? The Basic Principles
At their core, dynamometers work by providing adjustable resistance levels that “absorb” and measure power from a spinning engine. Instead of driving wheels that propel a vehicle down the road, the engine hooks up to heavy rollers and tries to spin them faster against deliberate friction forces.
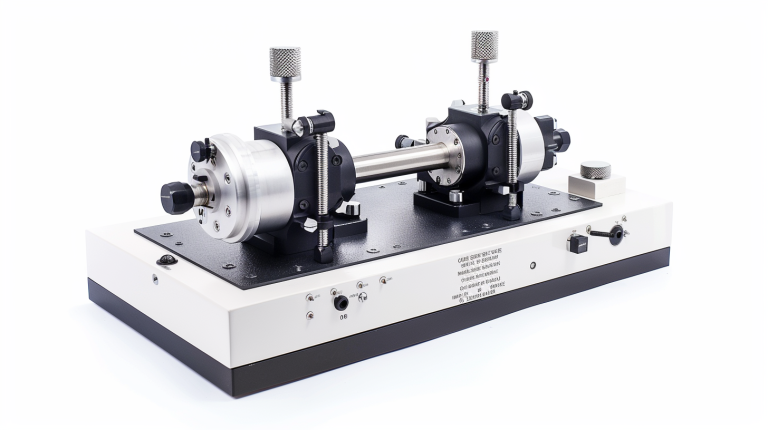
Mechanical dynamometers use physical braking on the dyno’s rotating drums to provide a precise, variable load. Specialty materials in the brake pads grip the drum surface with carefully calibrated drag. Actuators modulate clamping force on the rotors to increase or decrease resistance as needed. This mechanical resistance principle directly restrains drum motion, forcing the engine to work harder.
Electrical dynamometers convert generated rotational energy into heat dissipated through large resistor grids. Spinning the dyno faster accelerates power generation from integrated electromagnets/motors. This charges the resistor banks to specified capacities, absorbing more energy as speed increases per programming. Cooling fans and water jackets prevent overheating.
Sensors play a crucial role in quantifying dynamometer tests. Encoders mounted on the spinning shaft measure RPM with high resolution. Torque sensors on the dyno axle detect force levels based on minute mechanical deformations. Load cells under the rollers track weight shifts. Additional temperature, voltage, current, and other sensors feed data acquisition systems. The software converts sensor outputs into performance metrics like horsepower and lb-ft of torque.
By continuously calibrating resistance quantities electronically or mechanically, dynamometers can hold an engine at a steady speed/load or force it to work harder across programmable test profiles. They spin hundreds of pounds of thick steel rollers faster than programmed levels, which takes tremendous mechanical power. The sensors provide feedback for control systems to simulate real-world driving strains. The resulting dyno graphs plot power and torque curves needed to overcome the variable resistance across demand levels – the actual test of an engine’s real-world capabilities.
Types of Dynamometers
- Chassis Dynamometers: Used for vehicle-level testing, chassis dynos measure the performance of the entire drivetrain from the engine through the wheels. Vehicles get strapped down on rollers with integrated simulation and sensing. Electrically controlled absorbers recreate road loads—the changing forces from air resistance to tire friction that vehicles overcome when accelerating. Chassis dynos thus test overall vehicle attributes like fuel economy under simulated road conditions.
- Engine Dynamometers: Optimized for detailed engine testing, engine dynos are directly coupled to the motor without other drivetrain components. This allows isolated engine calibration by eliminating confounding gearbox losses, differential losses, etc. A short driveshaft links the engine output to the thick dyno drums for precise power testing under steady or transient speed/load changes.
- Absorption Dynamometers: The most common type, absorption dynamometers, provide variable resistance forces to restrain the engine, using electrical or mechanical braking on the spinning rollers. The more torque and power the engine outputs in overcoming those loads gets measured through integrated sensors.
- Motoring Dynamometers: Reversely, motoring dynamometers drive the unit being tested, spinning it via integrated electric motors. This enables precise speed regulation for motored testing along programmed RPM cycles and facilitates efficiency optimization across engine operating ranges. Hybrid designs combine motoring and absorption capabilities.
The dynamometer type impacts supported testing parameters and desired fidelity, but all quantify engine or drivetrain responses to calibrated resistance loads. Customization enables the recreating of diverse real-world strain conditions.
Considerations for Dyno Testing
Conducting reliable, insightful dynamometer tests relies on addressing several key factors:
- Accuracy: All instrumentation must precisely quantify performance. Establishing measurement integrity involves using NIST-traceable references to calibrate load cells, torque sensors, and other electronics. Control systems compensate for ambient temperature, humidity, and atmospheric pressure variations during tests to maintain strict tolerances.
- Repeatability: Quality dyno labs emphasize the ability to reproduce consistent, comparable results across months or years of testing the same unit. This verifies accurate, precise load application and sensor fidelity. Statistical variability between repeat test runs on a given engine should have minimal deviation if the equipment operates optimally.
- Sensor Precision: High-resolution encoders, scanning dataloggers, and noise reduction circuits allow the detection of small changes in output: 1000+ torque and RPM samples per second capture transient dynamics missed by slower equipment.
- Data Acquisition: Advanced data recording equipment converts sensor readings into real-time actionable output charts. Specialized software compensates testing loads for environmental conditions and engine-specific torque correction factors for accurate horsepower figures. Quick visual feedback facilitates modifying test parameters.
- Environmental Controls: Given engine output sensitivities, ambient temperature swings of just a few degrees can skew results if uncontrolled. So, labs enclose dynamometers in climate-regulated cells to maintain ideal air and coolant temperatures. Humidity control reduces variance, and vibration isolation platforms prevent interference.
Consistent testing conditions, precision instrumentation, and robust data crunching are indispensable in extracting actionable dyno test insights. Given narrow performance gains when incrementally optimizing modern powertrains, the dynamometer is only as good as its peripherals. Startups invest in the latest sensor, data processing, and environmental regulation equipment to leverage total value from the core absorption or motoring hardware. The overall system balance enables reproducible baseline testing and discerning minute performance differences from run to run.
Understanding and Interpreting Dyno Graphs
Dynamometer test results translate into performance curves with RPM on the X-axis and torque/horsepower on the Y-axis. Sensors quantify resistance load data into output charts as engines run from idle to redline.
Torque represents rotational force overcoming load at a given RPM. Horsepower conveys work done over time, calculated from torque and RPM figures. The curves demonstrate power and torque capabilities across operating speeds.
Weather corrections offset ambient test condition variances. Corrected metrics represent engine performance at a standardized 59°F, 29.31 inHg, and 0% humidity. This accounts for air density and friction changes from external conditions that impact results.
Output curves characterize an engine’s real-world mechanical abilities. Sweeping curve shapes indicate responsiveness – peaky engines build power rapidly in a rev range and then taper off, while flat curves sustain consistent output across RPMs. The peak horsepower denotes maximum power capability. Peak torque determines muscular force.
Ideally, torque peaks somewhat below max horsepower RPM to provide robust mid-range punch while achieving high peak power. Overly peaky or flat power delivery and max torque occurring too early reduces versatility. So, tuning optimizes the area under the curve.
Significant jagged fluctuations may indicate fueling deficiencies, sensor glitches, or mechanical issues requiring further diagnosis. Smooth, progressive curves mark a healthy response. The goal is to maximize the total area inside both plots across the RPM range.
Correction factors help compare runs from different ambient temperatures or dyno types. “SAE correction” adjusts to standard sea-level air density. The rate of power increase mathematically ranks responsiveness between runs instead of just absolute peaks. Corrected figures enable standardized comparisons.
The precise environmental controls today enable exceptional repeatability in testing. But sensor condition compensation helps filter external variability as engines push the envelope.
Conclusion
From professional racing crews to amateur restorations, dynamometers are indispensable in engine development across motorsports and automotive fields. Their ability to absorb and quantify power output under various simulated operating conditions relies on adjustable physical or electrical resistance mechanisms. Precision sensors feed data acquisition systems that portray performance in easily interpretable graphs. Visiting torque and horsepower curves facilitates optimizing tuning even when pushing the envelope. As vehicles advance with tighter emissions and efficiency requirements, precise and reproducible dynamometer lab testing will only grow in popularity and necessity. Both professional race teams and hobbyists find the dyno graphs invaluable for maximizing power and drivability from internal combustion and electric powertrains.


