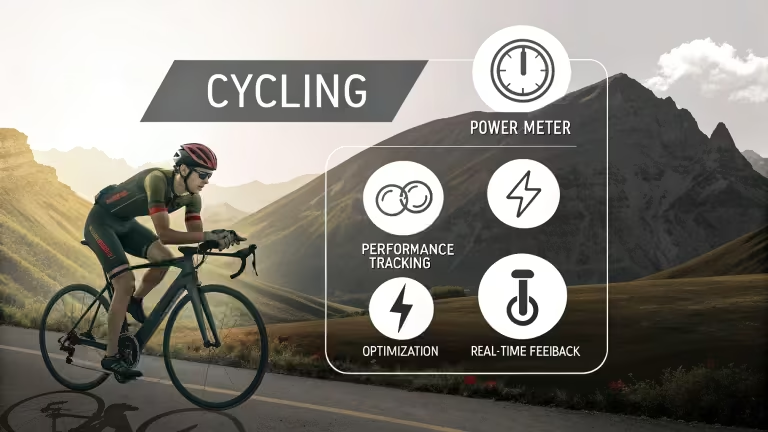
Power meters are not just for elite cyclists. They are versatile tools that have become more affordable and popular among cyclists at every level. Whether you’re a weekend warrior or a competitive cyclist, learning to analyze power meter data for cycling can initially feel overwhelming. You see all those numbers on your bike computer and wonder what they mean for your training. But fear not, these devices provide objective data that takes the guesswork out of training intensity and progress tracking, making them suitable for all cyclists.
Power meter data analysis is a powerful tool that can transform your training. But it’s not without its pitfalls. This guide is here to help you navigate the potential minefield of common mistakes that can trip up new power meter users. By effectively analyzing power meter data cycling, you can set proper training zones, track fitness improvements, and avoid overtraining. This guide walks you through everything from basic metrics to advanced analysis techniques, ensuring you make informed decisions about your training.
Whether you’re a weekend warrior or competitive cyclist, mastering power data analysis will make your training more effective and enjoyable.
Understanding Basic Power Meter Data
Power meters measure the work you produce while pedaling, expressed in watts. Think of watts like the horsepower of your legs – the higher the number, the more force you’re applying to move your bike forward. Power equals force multiplied by velocity, so you can increase power by pedaling harder, faster, or both.
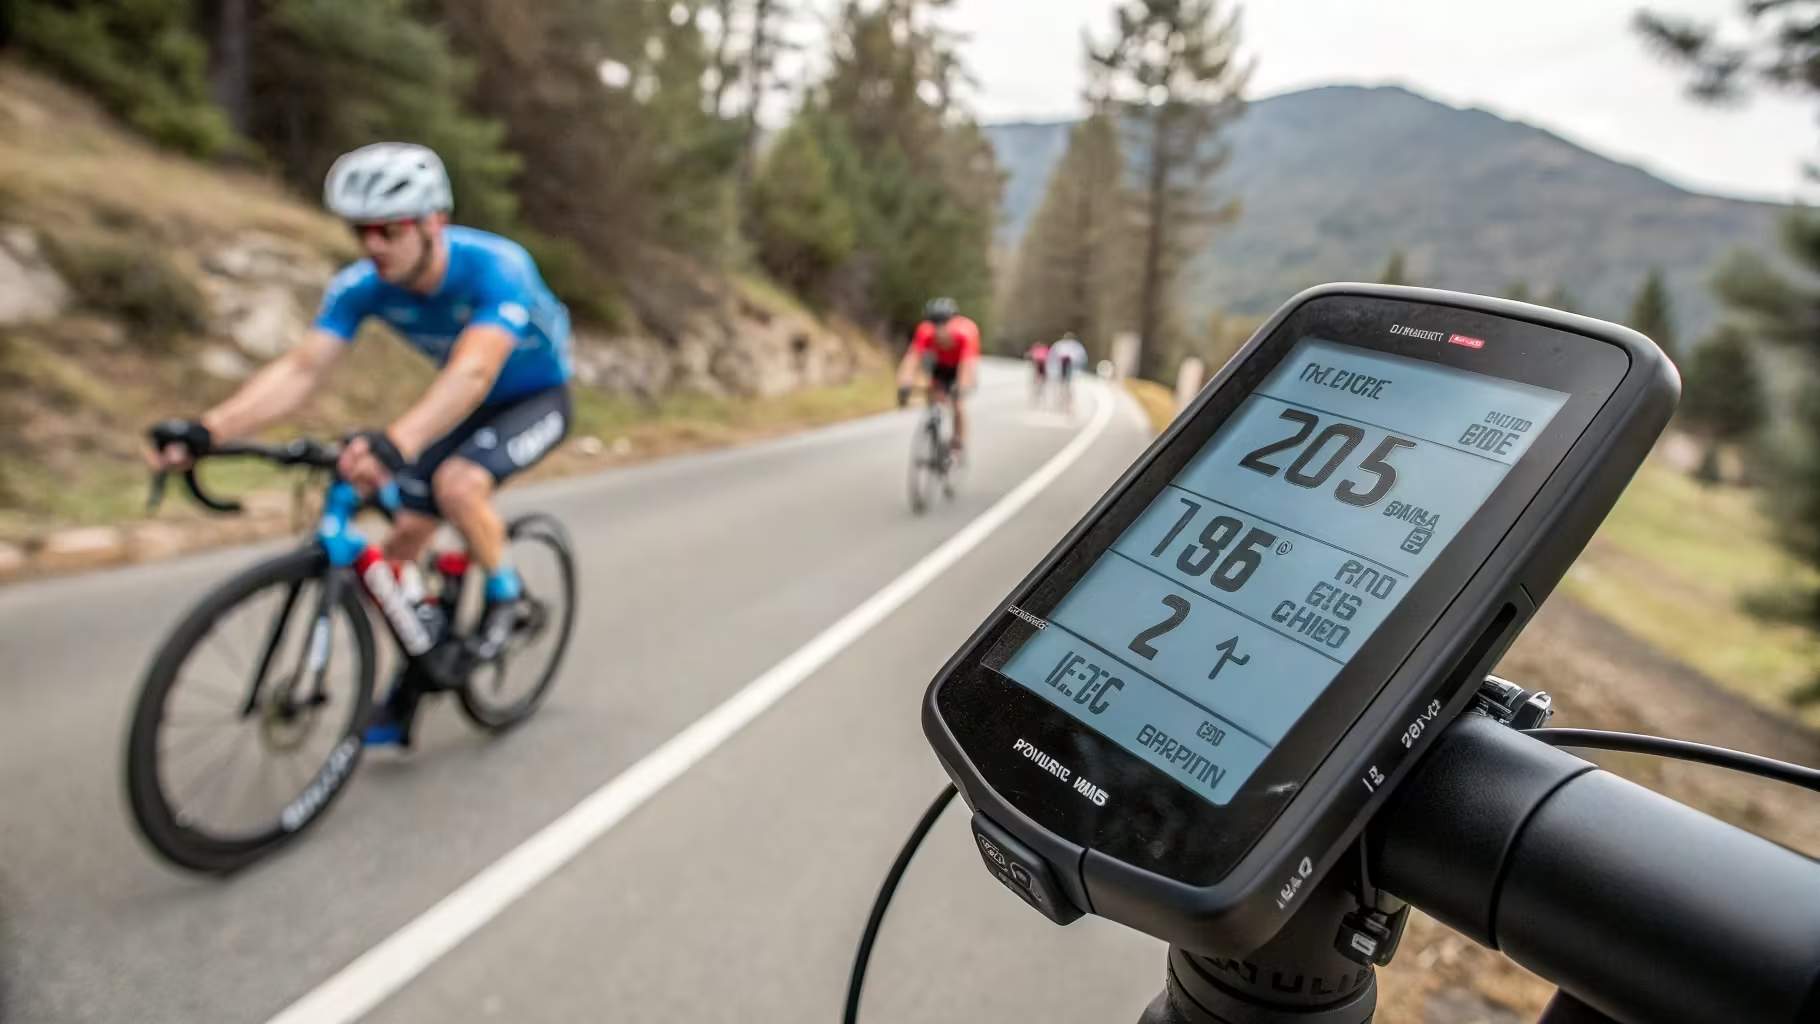
Your bike computer displays several types of power data during rides. Current power shows your instantaneous output, but jumps around too much to be useful for pacing. Most cyclists display 3-second or 10-second average power instead, which smooths out the fluctuations while staying responsive to effort changes.
Average power calculates the mean of all power values throughout your ride, including time spent coasting at zero watts. This metric helps you understand overall workout intensity, but doesn’t tell the whole story about variable efforts like intervals or hill climbs.
Power meters come in pedal-based, crank-mounted, or hub-based systems. Pedal power meters offer easy installation and bike swapping, but may be less durable. Crank-based systems provide excellent accuracy and protection from crashes. Hub-based meters are very reliable, but limit you to one wheel.
The key advantage of powerful data is its immediate response and consistency. Unlike heart rate, which takes 90-120 seconds to respond to effort changes, power readings change instantly when you work harder or easier.
Essential Power Analysis Metrics Explained
Normalized Power is one of the most essential concepts for effectively analyzing power meter data cycling. While average power includes all the zeros from coasting, Normalized Power calculates what your power output would have been if you maintained a steady effort with the exact physiological cost. This weighted average gives higher importance to more strenuous efforts and better reflects the actual stress of variable rides. For example, if you have a ride with a lot of strenuous efforts and coasting, your average power might be 200 watts, but your Normalized Power might be 250 watts, reflecting the actual intensity of the ride.
Functional Threshold Power (FTP) serves as your personal power benchmark. FTP represents the maximum average power you can sustain for approximately one hour. Most cyclists determine FTP through a 20-minute test, then multiply the result by 0.95 to estimate their hour power. Your FTP becomes the foundation for setting training zones and measuring fitness improvements over time. For example, if you can sustain an average power output of 300 watts for 20 minutes, your estimated FTP would be 285 (300*0.95).
Training Stress Score (TSS) quantifies how hard a workout was on your body. The formula combines a single number of workout duration, intensity, and FTP. A one-hour ride at FTP equals exactly 100 TSS points. Easy rides generate 50-100 TSS, while hard training sessions can reach 200-300 TSS. TSS is a valuable tool for understanding the cumulative stress of your training and ensuring you’re not overtraining.
Intensity Factor shows how hard you worked relative to your FTP. It’s calculated by dividing Normalized Power by your FTP. An easy endurance ride might have an Intensity Factor of 0.65, while a hard interval session could reach 0.95 or higher.
Kilojoules measure the total energy you expended during a ride. One kilojoule roughly equals one calorie, making this metric useful for nutrition planning and comparing workout volumes across different ride types.
Setting Up Effective Power Training Zones
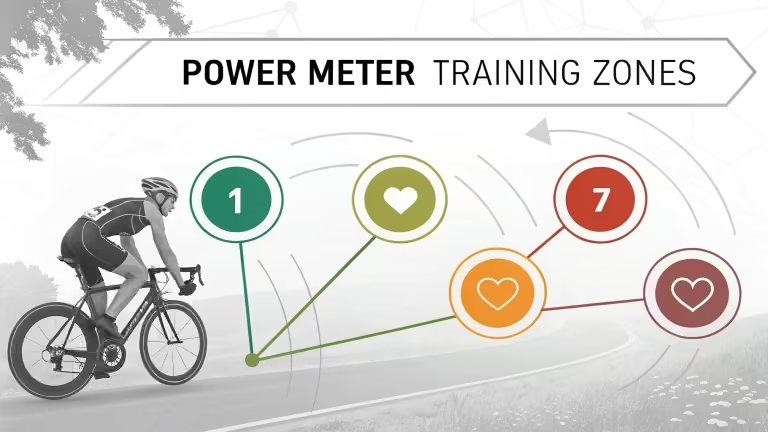
Power zones divide your training intensity into seven ranges based on FTP percentages. Zone 1 covers active recovery efforts below 55% FTP, perfect for easy spinning between intervals or recovery rides. Zone 2 spans 55-75% FTP and forms the foundation of endurance training, where you can chat comfortably while riding.
Zone 3 (75-90% FTP) represents tempo pace – harder than endurance but sustainable for 60-90 minutes. Zone 4 covers your lactate threshold around 90-105% FTP, the intensity you can maintain for 30-60 minutes with focused effort. Zone 5 (105-120% FTP) targets VO2 max development through 3-8 minute intervals.
Cycling Power Training Zones Based on FTP Percentage
Zone 6 anaerobic capacity (120-150% FTP) develops your ability to clear lactate through short, intense efforts. Zone 7 represents neuromuscular power above 150% FTP for sprint development and peak power improvements.
FTP testing requires proper preparation and execution. Choose a steady climb or an indoor trainer for consistent conditions. After a thorough warm-up, which included some more strenuous efforts, maintain the highest sustainable power for 20 minutes. Your average power for those 20 minutes, multiplied by 0.95, estimates your FTP.
Retest your FTP every 6-8 weeks during training periods. Fitness improvements mean your zones need updating to maintain appropriate training stimulus. Most cyclists see 10-20 watt FTP gains with consistent training, though improvements slow as fitness advances.
Zone-based training works because different intensities stress different energy systems. Mixing zone targets throughout your weekly training develops all aspects of cycling fitness while preventing overemphasizing any area.
Best Power Analysis Software Platforms
The right software determines how effectively you can analyze power meter data cycling. TrainingPeaks leads the professional market with comprehensive analysis tools, including TSS tracking, Performance Management Charts, and advanced metrics. The premium subscription costs $19.95 monthly but provides detailed insights for serious athletes and coaches.
Golden Cheetah offers robust free analysis for tech-savvy users. This open-source platform supports custom charts, Python integration, and extensive data manipulation. While the learning curve is steeper, Golden Cheetah provides professional-level analysis without subscription costs.
Strava works well for social training and fundamental power analysis. The free version shows power curves and segment analysis, while Strava Premium adds training log features and deeper metrics. Most recreational cyclists find Strava sufficient for tracking progress and comparing efforts with friends.
Garmin Connect integrates seamlessly with Garmin devices and provides solid fundamental analysis. The platform calculates FTP, tracks training load, and offers workout suggestions. While not as comprehensive as TrainingPeaks, it’s free and user-friendly for Garmin ecosystem users.
Mobile apps have improved significantly for quick, powerful data review. Most platforms now offer responsive mobile interfaces for checking key metrics after rides. However, detailed analysis works best on desktop computers with larger screens and complete feature sets.
Consider your analysis needs when choosing software. Casual riders prefer simple, free options like Strava or Garmin Connect. Competitive cyclists and coaches often justify TrainingPeaks’ cost for advanced features. Tech enthusiasts may enjoy Golden Cheetah’s customization options.
Advanced Power Data Analysis Techniques
Learning to analyze power meter data cycling at an advanced level involves several sophisticated metrics beyond basic power averages. Training Stress Score helps manage your overall training load by tracking cumulative fatigue over days and weeks. The Performance Management Chart plots your fitness (CTL), fatigue (ATL), and form (TSB) to guide training timing and recovery needs.
Power Duration Curves reveal your strengths and weaknesses across different time intervals. These curves plot your best power outputs from 5 seconds to several hours, helping identify whether you excel at sprinting, climbing, or time trialing. Comparing curves over time shows fitness improvements in specific areas.
Left-right power balance matters more than many cyclists realize. A balance over 5% may indicate bike fit issues, injury compensation, or technique problems. Dual-sided power meters provide this data automatically, while single-sided systems estimate total power by doubling one leg’s output.
W Prime (pronounced “W prime”) quantifies your anaerobic work capacity above FTP. This metric, measured in kilojoules, represents how much high-intensity work you can perform before recovery. Typical values range from 6-25 kJ for most cyclists, with sprinters generally having higher W’prime stores.
The Variability Index compares how steady your power output was during a ride. Low variability suggests consistent pacing, while high values indicate surging efforts. This metric helps evaluate pacing strategies for time trials and endurance events.
Advanced power meters reveal pedal smoothness and torque effectiveness. These metrics show how efficiently you apply force throughout the pedal stroke, identifying opportunities for technique improvements.
Step-by-Step Power Data Analysis Process
Developing a systematic approach to analyzing power meter data cycling saves time and ensures you extract meaningful insights from every ride. Start by reviewing the overall ride graph to identify intervals, climbs, and notable efforts. Look for power output patterns corresponding to terrain changes or workout structure.
Zero out your power meter before each ride to ensure accurate data. Most power meters have calibration procedures that take 10-30 seconds and eliminate measurement drift from temperature changes or other factors. Consistent calibration prevents data accuracy issues that complicate analysis.
Post-ride analysis begins with checking key summary metrics like average power, Normalized Power, TSS, and Intensity Factor. These numbers provide a quick overview of workout intensity and training load. Compare these values to your intended targets to evaluate execution quality.
Create segments for specific intervals or climbs to analyze performance in detail. Most software platforms allow you to highlight portions of rides and view isolated statistics. This segmentation helps track progress on repeated efforts like hill climbs or standard interval sets.
Look for trends across multiple rides rather than focusing on single sessions. Weekly and monthly views reveal fitness progressions that daily fluctuations can obscure. Pay attention to power improvements at consistent heart rates or increasing TSS tolerance over time.
Document observations and patterns in training logs. Note how power output relates to perceived effort, environmental conditions, and recovery status. These patterns help optimize future training and racing strategies.
Common Power Analysis Mistakes to Avoid
New power meter users often make predictable errors when learning to analyze power meter data cycling. Calibration problems top the list of accuracy issues. Forgetting the zero offset before rides creates measurement drift that makes data analysis meaningless. Temperature changes during long rides also affect power meter accuracy without proper compensation.
Misunderstanding Normalized Power leads to incorrect workout intensity assessments. Some cyclists think Normalized Power filters out coasting time. Still, the calculation accounts for the variable’s physiological cost. Two rides with identical average power can have very different Normalized Power values depending on how steady the efforts were.
FTP testing errors compromise all subsequent zone-based training. Testing on different courses, weather conditions, or recovery states produces inconsistent results. Maintain standard testing protocols and conditions for reliable FTP tracking over time.
Overemphasizing single ride data instead of looking at trends causes training mistakes. Power output naturally varies day-to-day based on fatigue, weather, and motivation. Focus on weekly and monthly patterns rather than getting discouraged by one poor performance.
Ignoring software settings creates data inconsistencies. Ensure your analysis platform includes zeros in power calculations but excludes them from cadence averages. Mixing different calculation methods between devices makes meaningful comparisons impossible.
Comparing power data between different riders without considering body weight produces misleading conclusions. Power-to-weight ratio (watts per kilogram) provides better performance comparisons, especially for climbing and overall cycling ability.
Power vs Heart Rate Analysis Comparison
Understanding when to use power versus heart rate helps optimize how to analyze power meter data cycling for different training goals. Power provides instant feedback, making it perfect for interval training and precise effort control. You can target exact wattages during work intervals and monitor fatigue as power output drops throughout the session.
Heart rate responds slowly to effort changes, taking 90-120 seconds to reflect new intensities. This delay makes heart rate less useful for short intervals but valuable for monitoring overall cardiovascular stress and recovery. Environmental factors like heat, dehydration, and caffeine affect heart rate but don’t influence power readings.
Power measurements stay consistent regardless of external conditions. Two hundred watts requires the same muscular effort, whether fresh, fatigued, hot, or cold. Heart rate for the same power output can vary significantly based on hydration status, sleep quality, and ambient temperature.
Cardiac drift causes heart rate to rise during long, steady efforts even when power remains constant. This phenomenon makes heart rate less reliable for pacing endurance events. Power provides stable pacing targets that better account for progressive fatigue than heart rate zones.
Combining both metrics gives the most complete training picture. Use power for workout execution and pacing, while monitoring heart rate for signs of overreaching or incomplete recovery. Elevated heart rate at standard power outputs often indicates the need for additional rest or reduced training intensity.
Cost differences make heart rate monitoring more accessible for budget-conscious cyclists. Quality heart rate monitors cost $30-150, while power meters range from $300-2000. However, power meter prices continue dropping as technology improves and competition increases.
Applying Analysis Results to Training
Converting power data insights into better training requires systematically applying analysis results. Use FTP improvements to update training zones every 6-8 weeks, ensuring workout intensities match your current fitness level. Outdated zones lead to ineffective training, either too easy or too hard.
TSS tracking helps balance training stress with recovery needs. Target weekly TSS totals that increase gradually over 3-4 week blocks, followed by easier recovery weeks. Most recreational cyclists handle 300-600 weekly TSS, while competitive riders may reach 800-1200 TSS during peak training.
Power duration curve analysis reveals specific weaknesses that need targeted training. Poor 5-15-second power suggests sprint development needs, while weak 20-60-minute power indicates threshold training gaps. Design workout plans that address identified limitations while maintaining strengths.
Power analysis benefits race pacing strategies enormously. Study power files from similar events to establish sustainable pacing targets. Time trials require very steady power output just below FTP, while criteriums involve frequent power spikes above the threshold followed by recovery periods.
Seasonal periodization uses power metrics to guide training emphasis throughout the year. Base training periods focus on building Zone 2 volume, while build phases add Zone 4-5 intensity. Specialty phases target race-specific power demands using event analysis data.
Recovery monitoring through power analysis prevents overtraining. Declining power at consistent heart rates signals accumulating fatigue that requires rest. Morning power tests or short efforts can reveal readiness for hard training versus the need for recovery rides.
Wrapping Up Your Power Analysis Journey
Mastering how to analyze power meter data cycling takes practice, but the performance benefits make the effort worthwhile. Start with basic metrics like FTP and TSS before progressing to advanced analysis techniques. Choose analysis software that matches your current needs and budget, knowing you can always upgrade later as your skills develop.
Remember that power data only has value when applied to improve your training and racing. Don’t get lost in numbers for their own sake – use analysis insights to make better decisions about workout intensity, recovery timing, and race pacing strategies. The cyclists who improve most effectively combine data analysis with consistent training and innovative recovery practices.
Power meter technology will continue to advance, but the fundamental principles of analysis remain constant. Focus on understanding key metrics and their applications rather than chasing every new feature or measurement. Your power data tells a story about your fitness and performance—learning to read that story accurately gives you a significant advantage in reaching your cycling goals.

